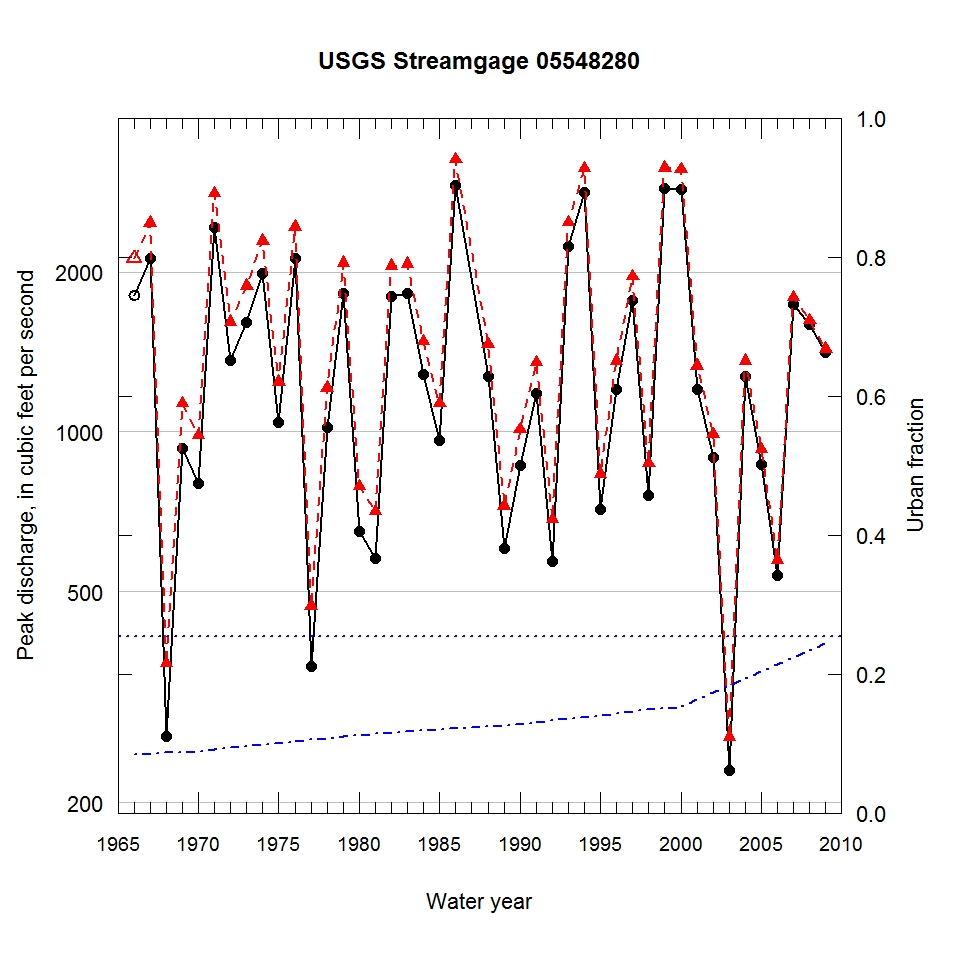
Observed and urbanization-adjusted annual maximum peak discharge and associated urban fraction and precipitation values at USGS streamgage:
05548280 NIPPERSINK CREEK NEAR SPRING GROVE, IL


| Water year | Segment | Discharge code | Cumulative reservoir storage (acre-feet) | Urban fraction | Precipitation (inches) | Observed peak discharge (ft3/s) | Adjusted peak discharge (ft3/s) | Exceedance probability |
| 1966 | 1 | 7 | 10257 | 0.084 | 0.513 | 1810 | 2120 | 0.192 |
| 1967 | 1 | -- | 10257 | 0.085 | 1.523 | 2120 | 2470 | 0.127 |
| 1968 | 1 | E | 10257 | 0.087 | 0.679 | 267 | 366 | 0.964 |
| 1969 | 1 | -- | 10257 | 0.088 | 0.981 | 931 | 1130 | 0.636 |
| 1970 | 1 | -- | 10257 | 0.089 | 0.981 | 799 | 983 | 0.722 |
| 1971 | 1 | D | 10257 | 0.091 | 0.496 | 2430 | 2810 | 0.083 |
| 1972 | 1 | D | 10257 | 0.094 | 0.793 | 1360 | 1610 | 0.373 |
| 1973 | 1 | -- | 10257 | 0.096 | 0.742 | 1610 | 1880 | 0.267 |
| 1974 | 1 | -- | 10257 | 0.098 | 1.018 | 1990 | 2290 | 0.158 |
| 1975 | 1 | -- | 10257 | 0.101 | 0.092 | 1040 | 1240 | 0.575 |
| 1976 | 1 | -- | 10257 | 0.103 | 1.294 | 2120 | 2430 | 0.134 |
| 1977 | 1 | D | 10257 | 0.105 | 0.833 | 362 | 469 | 0.942 |
| 1978 | 1 | -- | 10257 | 0.108 | 1.357 | 1020 | 1210 | 0.596 |
| 1979 | 1 | -- | 10257 | 0.110 | 0.291 | 1820 | 2080 | 0.200 |
| 1980 | 1 | -- | 10257 | 0.112 | 0.763 | 648 | 788 | 0.823 |
| 1981 | 1 | -- | 10257 | 0.114 | 0.759 | 578 | 708 | 0.859 |
| 1982 | 1 | 2 | 10257 | 0.115 | 0.330 | 1800 | 2050 | 0.209 |
| 1983 | 1 | -- | 10257 | 0.117 | 1.509 | 1820 | 2070 | 0.204 |
| 1984 | 1 | E | 10257 | 0.119 | 0.576 | 1280 | 1480 | 0.434 |
| 1985 | 1 | -- | 10257 | 0.120 | 0.505 | 962 | 1130 | 0.639 |
| 1986 | 1 | -- | 10257 | 0.122 | 1.348 | 2910 | 3260 | 0.053 |
| 1988 | 1 | -- | 10257 | 0.125 | 0.207 | 1270 | 1460 | 0.444 |
| 1989 | 1 | -- | 10257 | 0.126 | 1.877 | 603 | 724 | 0.852 |
| 1990 | 1 | -- | 10257 | 0.128 | 0.422 | 866 | 1010 | 0.705 |
| 1991 | 1 | -- | 10257 | 0.130 | 0.950 | 1180 | 1350 | 0.503 |
| 1992 | 1 | E | 10257 | 0.133 | 0.686 | 571 | 683 | 0.872 |
| 1993 | 1 | -- | 10257 | 0.135 | 1.480 | 2230 | 2480 | 0.125 |
| 1994 | 1 | -- | 10257 | 0.138 | 0.835 | 2830 | 3130 | 0.061 |
| 1995 | 1 | E | 10257 | 0.141 | 1.135 | 715 | 833 | 0.801 |
| 1996 | 1 | -- | 10257 | 0.143 | 1.104 | 1200 | 1360 | 0.501 |
| 1997 | 1 | -- | 10257 | 0.146 | 1.852 | 1770 | 1960 | 0.237 |
| 1998 | 1 | -- | 10257 | 0.148 | 1.133 | 758 | 872 | 0.781 |
| 1999 | 1 | -- | 10257 | 0.151 | 1.309 | 2870 | 3140 | 0.060 |
| 2000 | 1 | -- | 10257 | 0.154 | 2.626 | 2860 | 3120 | 0.061 |
| 2001 | 1 | -- | 10257 | 0.164 | 0.716 | 1200 | 1330 | 0.519 |
| 2002 | 1 | -- | 10257 | 0.174 | 1.695 | 893 | 988 | 0.720 |
| 2003 | 1 | E | 10257 | 0.184 | 0.759 | 230 | 266 | 0.984 |
| 2004 | 1 | -- | 10257 | 0.194 | 2.034 | 1270 | 1360 | 0.501 |
| 2005 | 1 | -- | 10257 | 0.203 | 0.718 | 868 | 926 | 0.755 |
| 2006 | 1 | -- | 10257 | 0.213 | 1.555 | 537 | 573 | 0.913 |
| 2007 | 1 | -- | 10257 | 0.223 | 1.886 | 1740 | 1790 | 0.297 |
| 2008 | 1 | -- | 10257 | 0.233 | 2.122 | 1590 | 1620 | 0.367 |
| 2009 | 1 | -- | 10257 | 0.243 | 0.701 | 1410 | 1430 | 0.465 |

